

Draw the system. See where it breaks.
Drag boundaries, components, and data flows onto a canvas. Give each element a class from a catalog that knows your stack, and the platform derives its exposures, scores them, maps them to MITRE ATT&CK, and lets you triage every one in place — over the same model the Dethereal plugin builds from the command line.
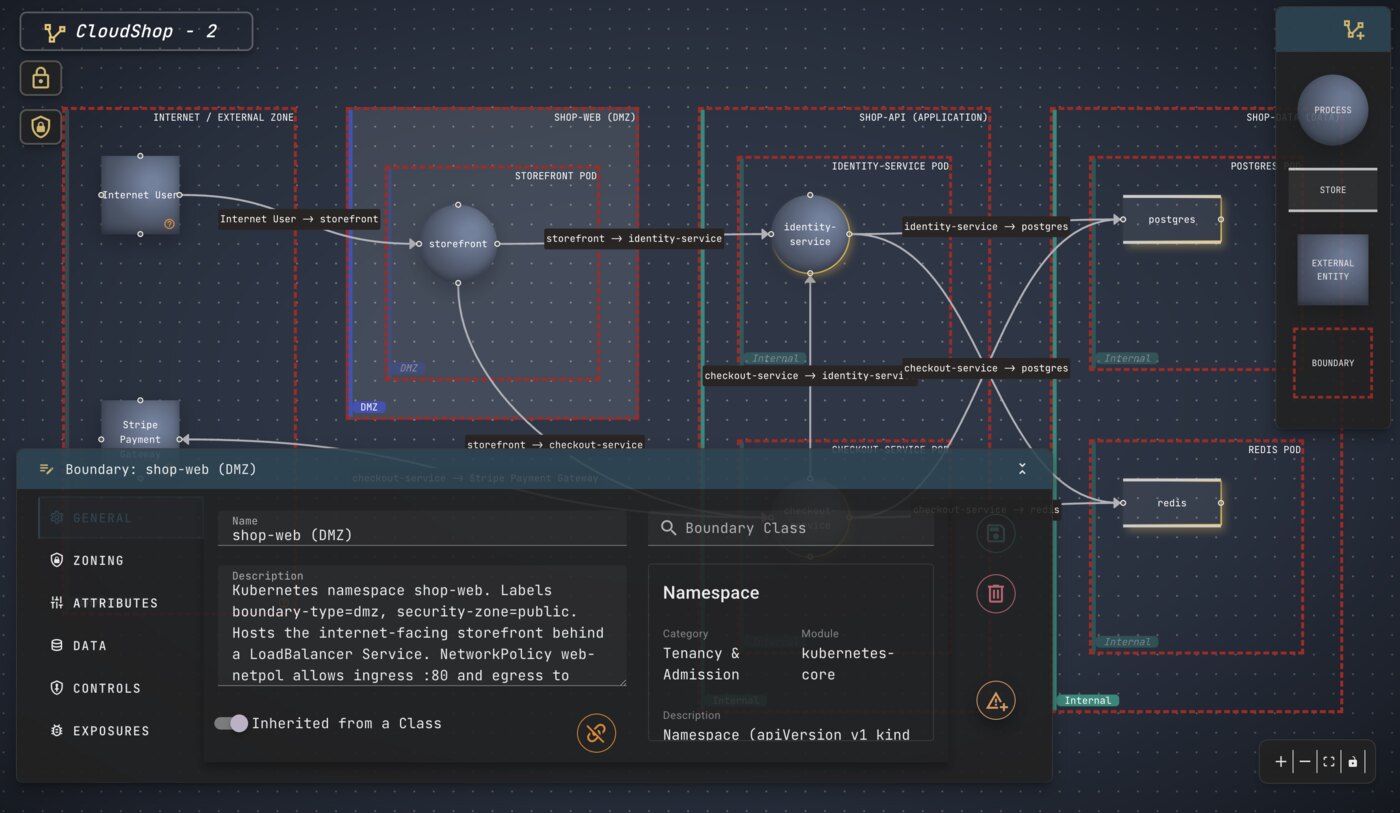
The CloudShop model on the canvas — drag from the palette on the right, and open any element to configure it.
Everything you place on the canvas — every boundary, component, and flow — is a structured element the analysis engine reads. Assign a class and it inherits that technology’s known weaknesses; change an attribute and the exposures re-derive. There is no separate “security model” to keep in sync: the picture you draw is the thing that gets analyzed.
It is the same split-file model the Dethereal Claude Code plugin builds and edits. Whiteboard a system here, enrich it from the CLI, and open it back on the canvas — one model, whichever interface fits the moment.
From a drawing to
a working threat model.
Place the elements, tell the platform what each one is, and the security reasoning follows — scored exposures, ATT&CK techniques, the controls that answer them, and the trust-zone intent to judge them against.
Pick from a catalog that knows your stack.
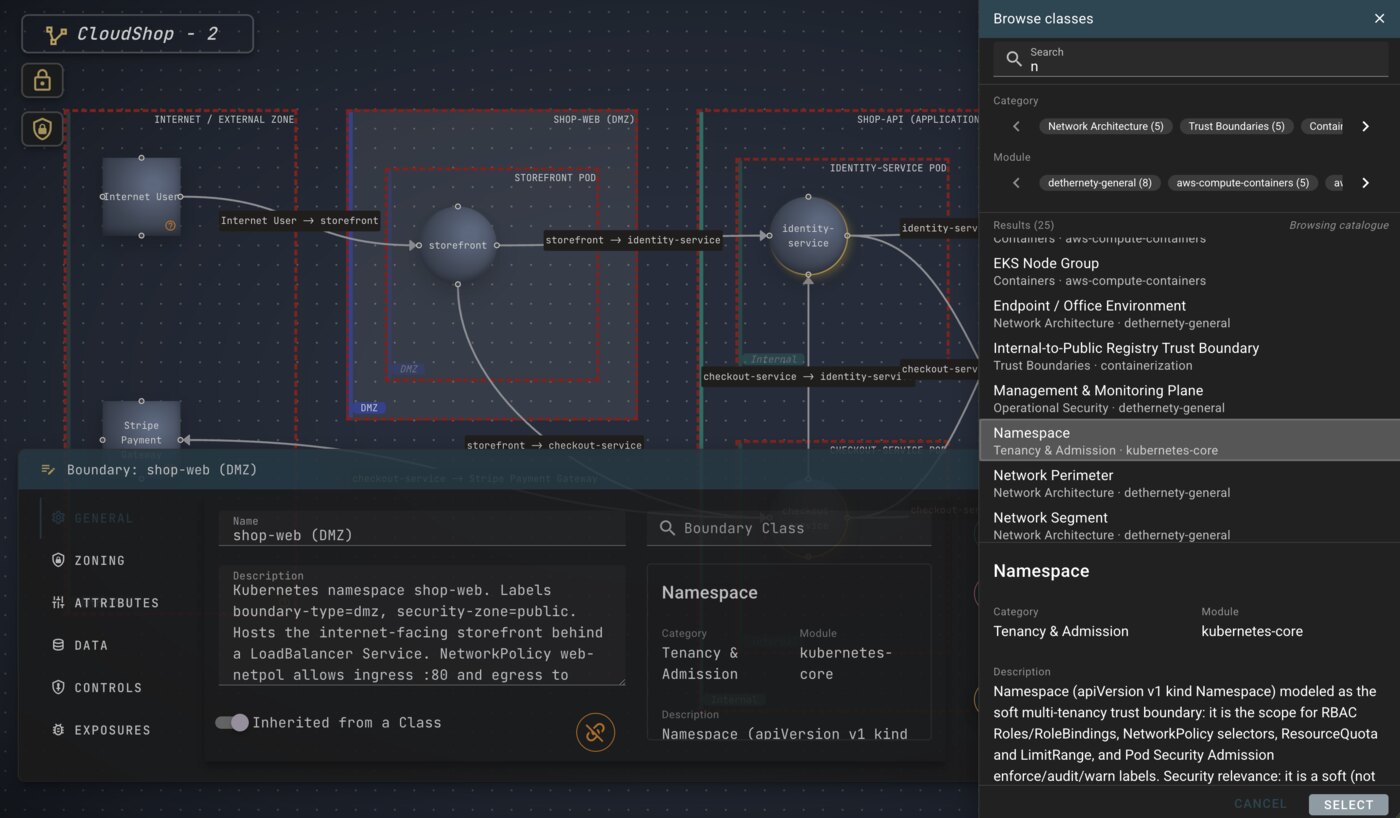
Every component, flow, and boundary takes a class from a searchable catalog — filtered by category and by module, from Kubernetes and AWS to network architecture and trust boundaries. The class carries what that technology tends to get wrong, so the moment you assign it, the element inherits a curated set of exposures and controls.
- Filter by category (Network Architecture, Trust Boundaries, Containers…) or by module (kubernetes-core, aws-compute-containers, dethernety-general…).
- Each class explains itself — a Kubernetes Namespace is modeled as a soft multi-tenancy trust boundary, and the catalog says exactly why.
- Load more modules and the catalog grows; you never hand-write a threat list.
Fill in what’s true — the platform tells you how to check.
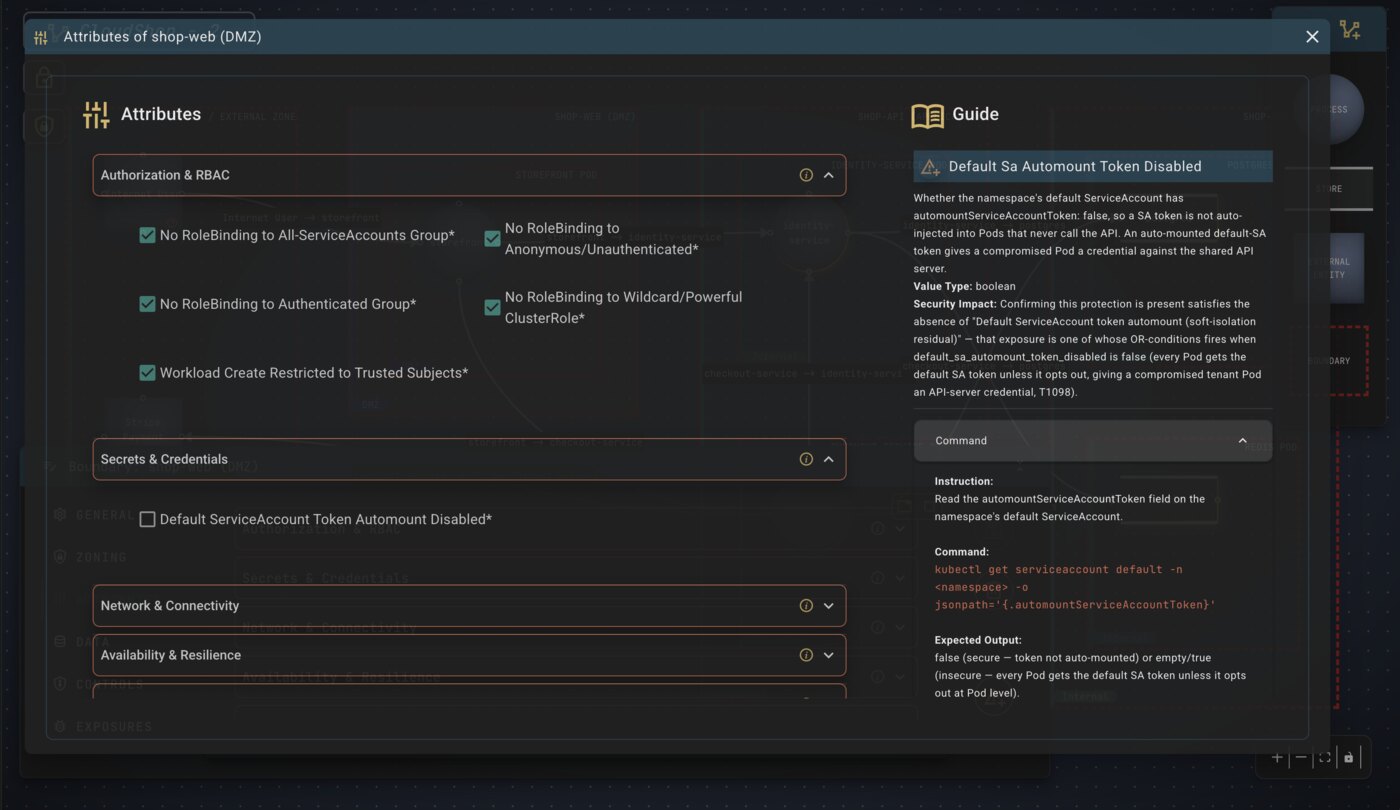
Each class asks for the attributes that shape its security: RBAC bindings, secret handling, network reachability, resilience. Every attribute comes with a guide that names its security impact, the technique it bears on, and the exact command to confirm it — so a ticked box is a verified fact, not a guess.
- Attributes are grouped and explained — “Default ServiceAccount Token Automount Disabled” names its impact and the ATT&CK technique (T1098) it bears on.
- The guide hands you the command — e.g. kubectl get serviceaccount default … — and the output that means secure versus exposed.
- Change an attribute and the exposures re-derive to match what you actually configured.
Every weakness, scored and mapped — then yours to triage.
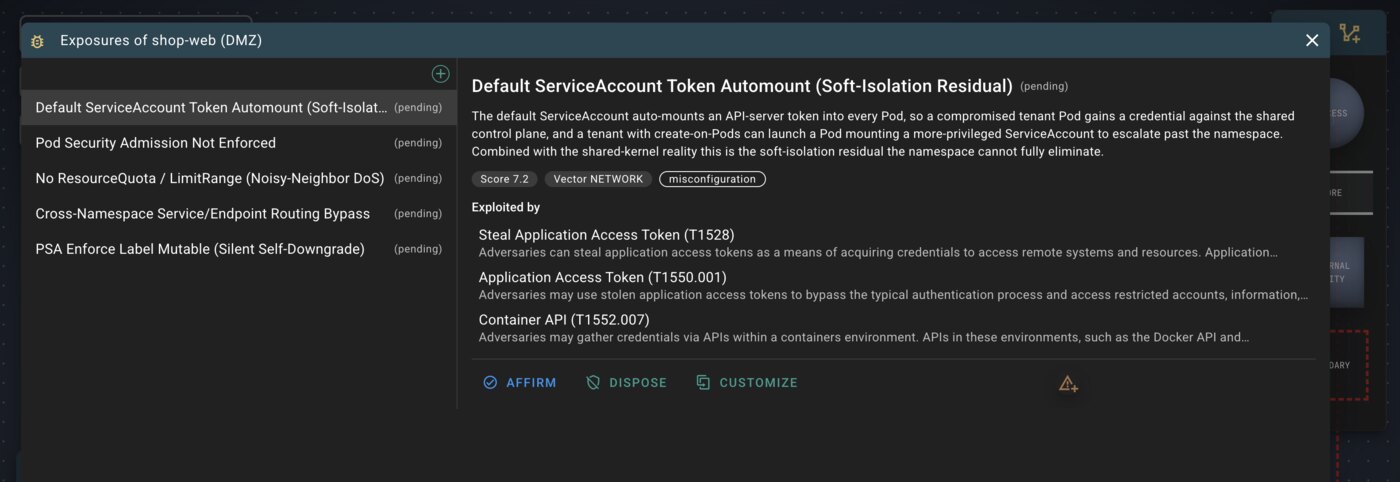
Open any element and its exposures are listed with a severity score, an attack vector, and the MITRE ATT&CK techniques an attacker would chain. Right there, you act: affirm it as a confirmed live risk, dispose it with a reason, or customize it into your own editable copy.
- Each exposure carries a score (7.2), a vector (NETWORK), and a class (misconfiguration) — no rolled-up single number hiding the detail.
- “Exploited by” names the techniques (T1528, T1550.001, T1552.007), so a finding lines up with the frameworks you already track.
- Affirm, Dispose, or Customize in place — your decision is recorded and survives the next re-derivation.
Credit the defenses you actually have.
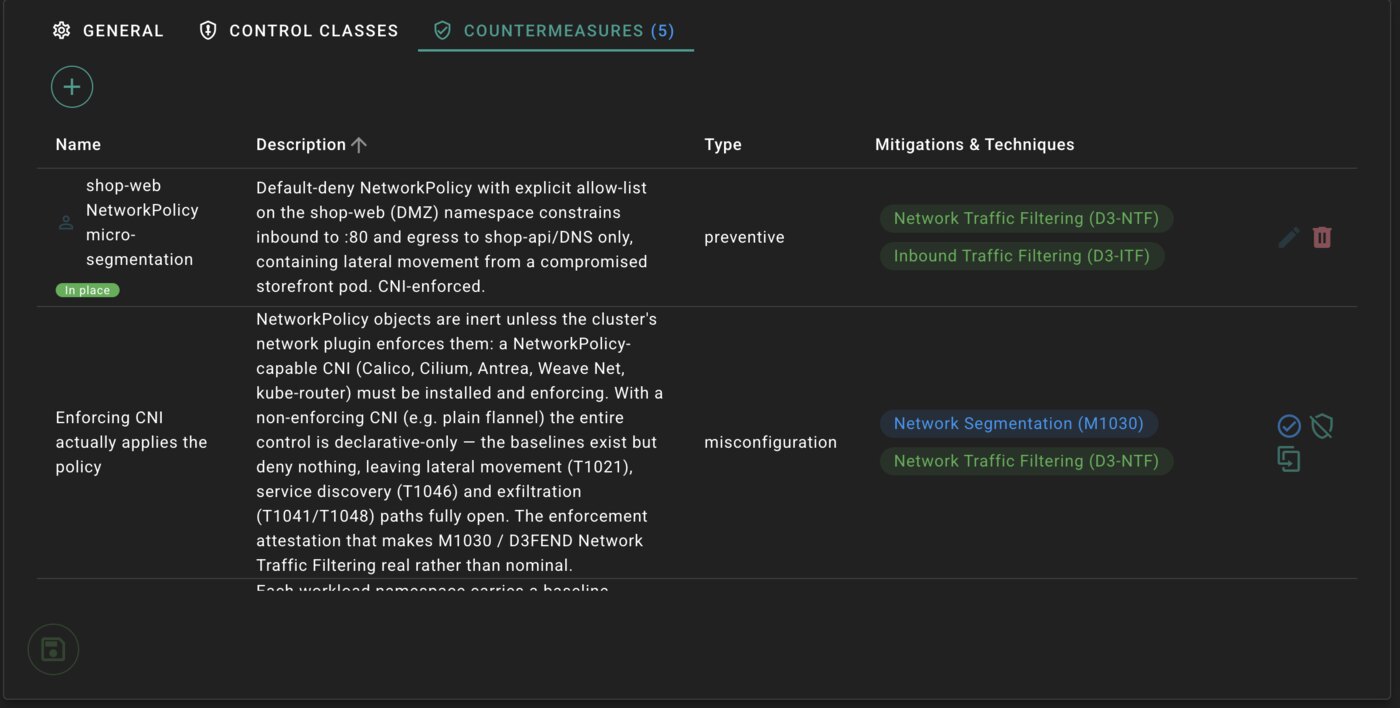
Attach security controls to your model and each derives its countermeasures — what it prevents, and the defensive techniques it implements. Mark a control in place and it steps down the residual risk on what it covers; leave a gap and the model points to the class of control that would close it.
- Countermeasures map to D3FEND and MITRE — Network Traffic Filtering (D3-NTF), Network Segmentation (M1030) — not just prose.
- A control states its own limits: a NetworkPolicy is inert without an enforcing CNI, and the model says so plainly.
- Controls come from a shared catalog, so a policy you define once applies everywhere it belongs.
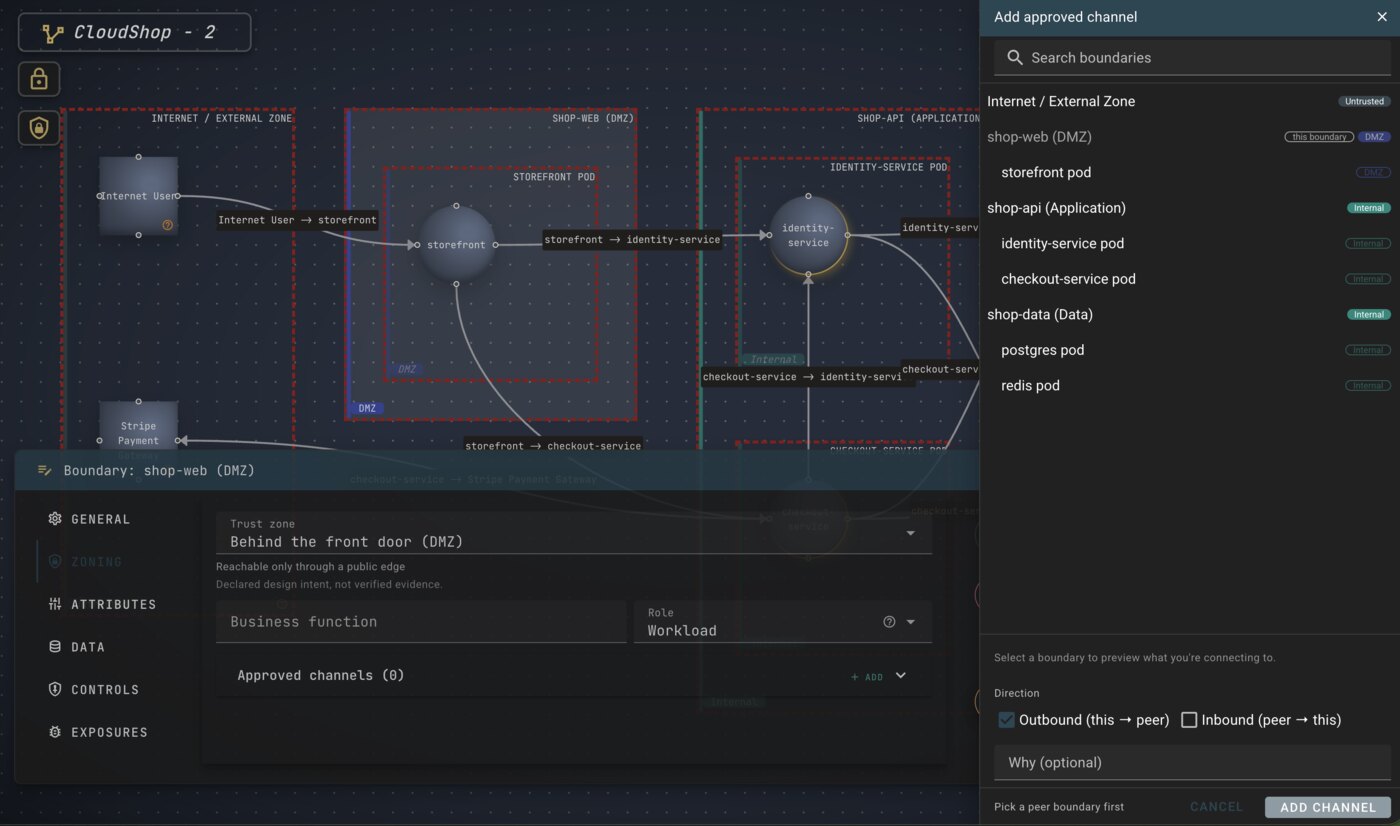
Declare how the system is meant to be segmented.
Place each boundary on a trust gradient — Internet-facing through Restricted — give it a business function and role, and declare the approved channels it may use to reach its peers. It captures the segmentation you intended, so analysis can flag any flow that breaks it.
- A consequence line restates each tier — “reachable only through a public edge” — so the choice is unambiguous, and zones inherit down the tree.
- Approved channels are picked from your actual boundaries, with a direction and an optional reason — a flow outside them becomes a finding.
- Zoning is recorded design intent, not enforced traffic; the panel says so, and leaves enforcement to analysis.
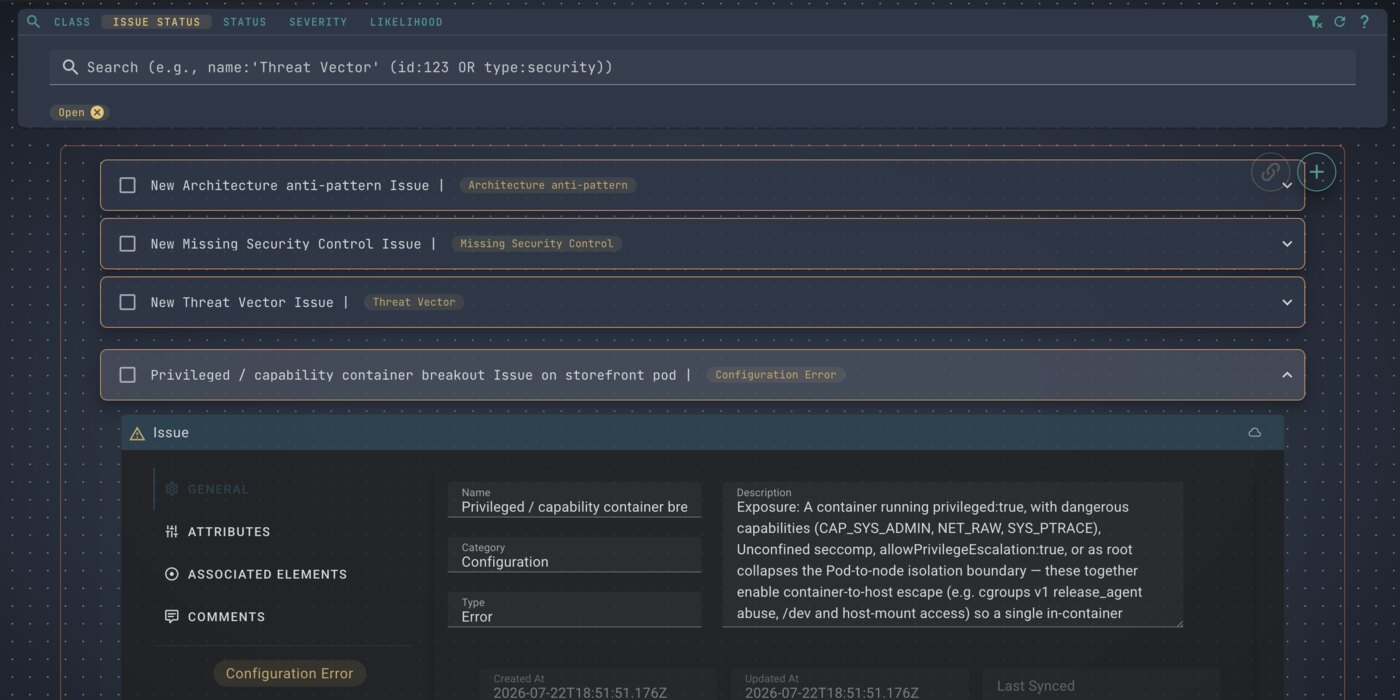
Turn a finding into tracked work — and keep the thread.
Raise any exposure into an issue and it carries the finding’s detail, its associated elements, and a comment trail. Work them on a filterable board by class, status, severity, or likelihood, and sync each out to Jira, ServiceNow, or GitHub through a module.
- An issue raised from a finding auto-links the analysis, the model, and the components it touches.
- Filter the board with a query — status:open, severity:critical, name:… — to surface what needs attention.
- Bidirectional sync keeps status and comments aligned with your external tracker.
Built for the work,
not just the picture.
The canvas is where you run the model, not just draw it — record decisions that stick, re-check them as the model moves, and carry work in and out without re-keying.
Findings lifecycle
Pending, confirmed, or disposed — each element shows a count of how many findings still await a first look.
Customize a finding
Take over a system-generated finding as an editable copy; the original stays on the record, marked superseded.
Stale-aware decisions
Change an attribute and any decision it affects is flagged to re-review — never silently kept as if nothing moved.
Model references
A component can represent another model, so a system-of-systems nests on one canvas without duplication.
Portable model
Export any model as a split-file ZIP and re-import it — the same format the Dethereal plugin reads and writes.
Reusable controls
Define a control once in the catalog and apply it across every model where that defense belongs.
Draw it here, or drive it from the CLI.
The canvas, the Dethereal plugin, and the analyses all read and write one model. Sketch a system on the canvas, enrich it from your terminal, and report on it in Threat Report — nothing is re-keyed, and the two views never disagree.
Every finding traces back to a choice you made.
An exposure exists because of the class you assigned and the attributes you set. Change an input and watch the findings move; open any one to read its description, its score, its ATT&CK techniques, and the sources behind it. There is no hidden number you can’t take apart.
Open a canvas and start modeling.
The Interactive GUI is the browser home of your threat model — draw the system, configure it by class, and work every finding it surfaces. Prefer the command line? The same model is a few slash commands away.