

Residual risk, without the flattering number.
Turn a threat model into a report you can drill, filter, and put in front of a board — MITRE coverage by tier, reachability to your crown jewels, boundary-policy verdicts, and a full residual-risk ledger, over one consistent snapshot. Every number traces back to your model, so nothing falls apart when someone pushes on it.
Illustrative — the report renders over a stored snapshot of your model.
Hand this to a board or an auditor and it holds — because every figure traces back to something in your model, not to a black-box score. Where a reassuring average would paper over a gap, the report shows the gap; a threat model can only tell you what you have drawn, not what is true in production.
A scope-and-freshness banner sits above every view, surfacing what the report can and can’t speak to — a stale snapshot, missing boundaries, unclassified data — before you read a single count. Read it first, every time.
Five views over
one consistent snapshot.
Every tab renders over the same stored snapshot, so the whole report stays internally consistent as you move around it. Switch views in place, drill into any element, filter down to what matters, and export it as JSON or a self-contained HTML page.
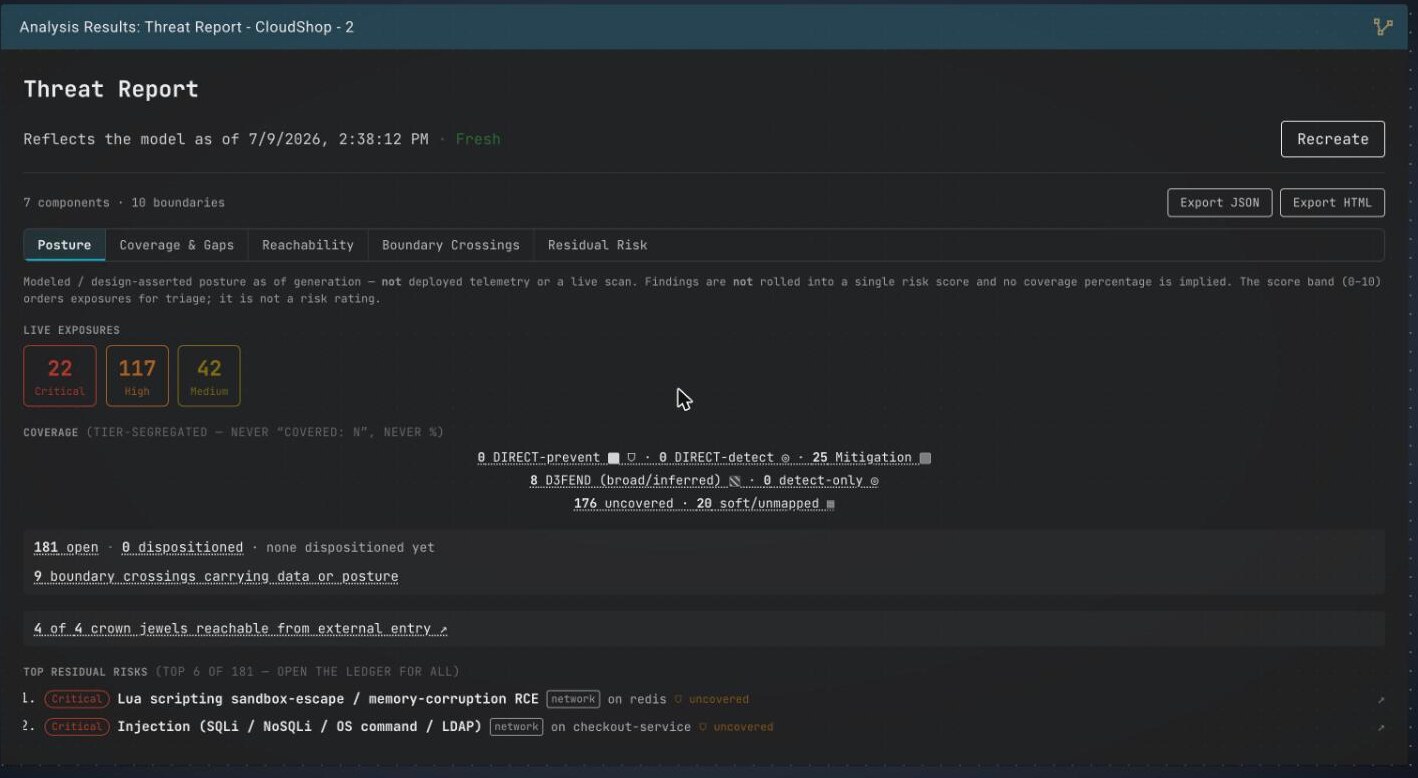
The whole model at a glance — one click into any number.
The landing view rolls everything up: live exposures by severity band, coverage by tier, open and reviewed counts, crown-jewel reachability, and your top residual risks. Every statistic is a link that jumps you into the detailed view, already filtered.
- Signals stay separate, and every figure links to the findings beneath it — so it holds when it’s questioned.
- Affirmed findings stay live and counted; only muted ones drop off.
- A separate defense-in-depth line counts controls, never folded into coverage.
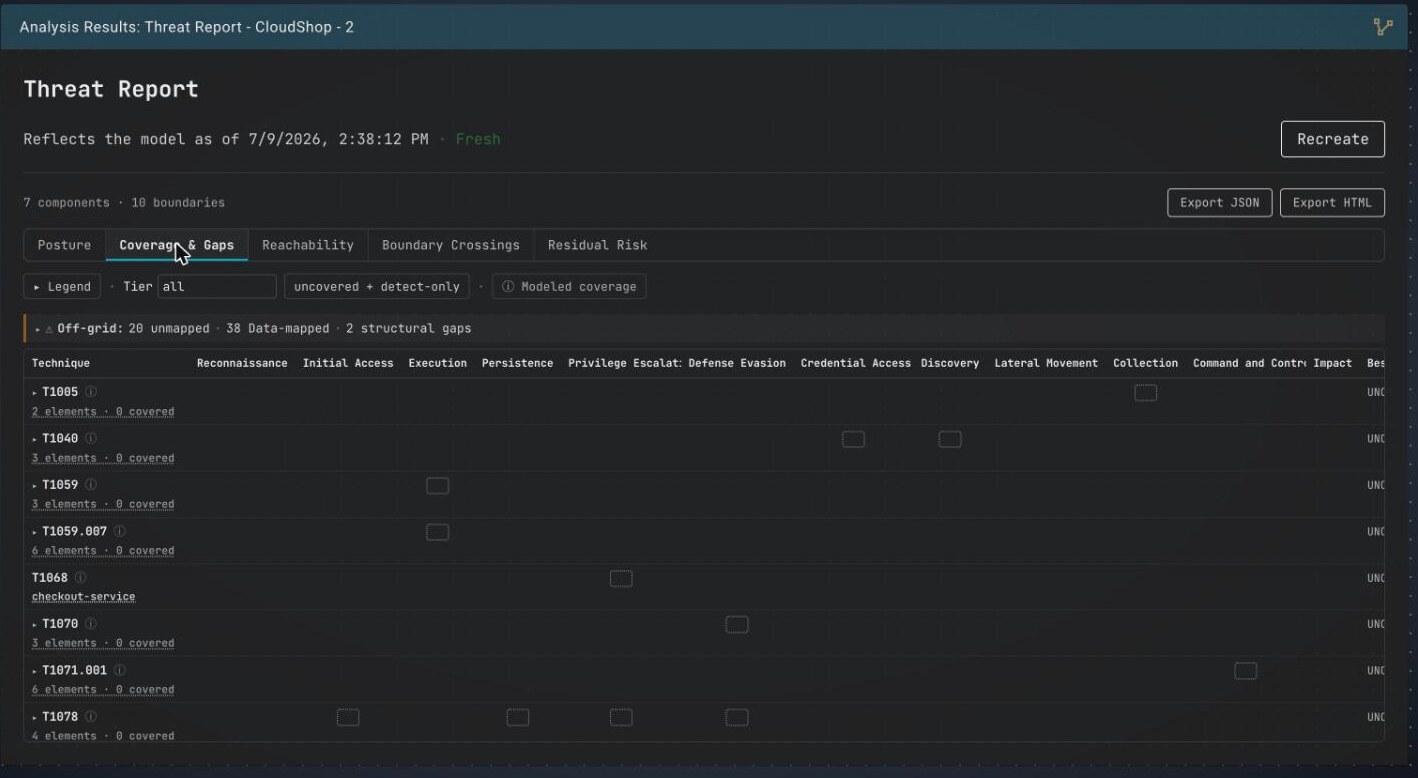
See exactly how strong each defense is — by technique, tier, and prevent-vs-detect.
A monochrome matrix charts your live exposures against the techniques they map to. Fill encodes the coverage tier; a single glyph says whether you can prevent the technique or only detect it. The off-grid line keeps the grid from ever reading as a false all-clear.
- Three tiers — DIRECT, Mitigation, D3FEND — shown distinctly, so you can tell a solid control from a broad inference.
- An uncovered + detect-only worklist: every technique you cannot currently prevent.
- Off-grid counts (unmapped, Data, structural gaps) stay in view — a clean grid is not a clean model.
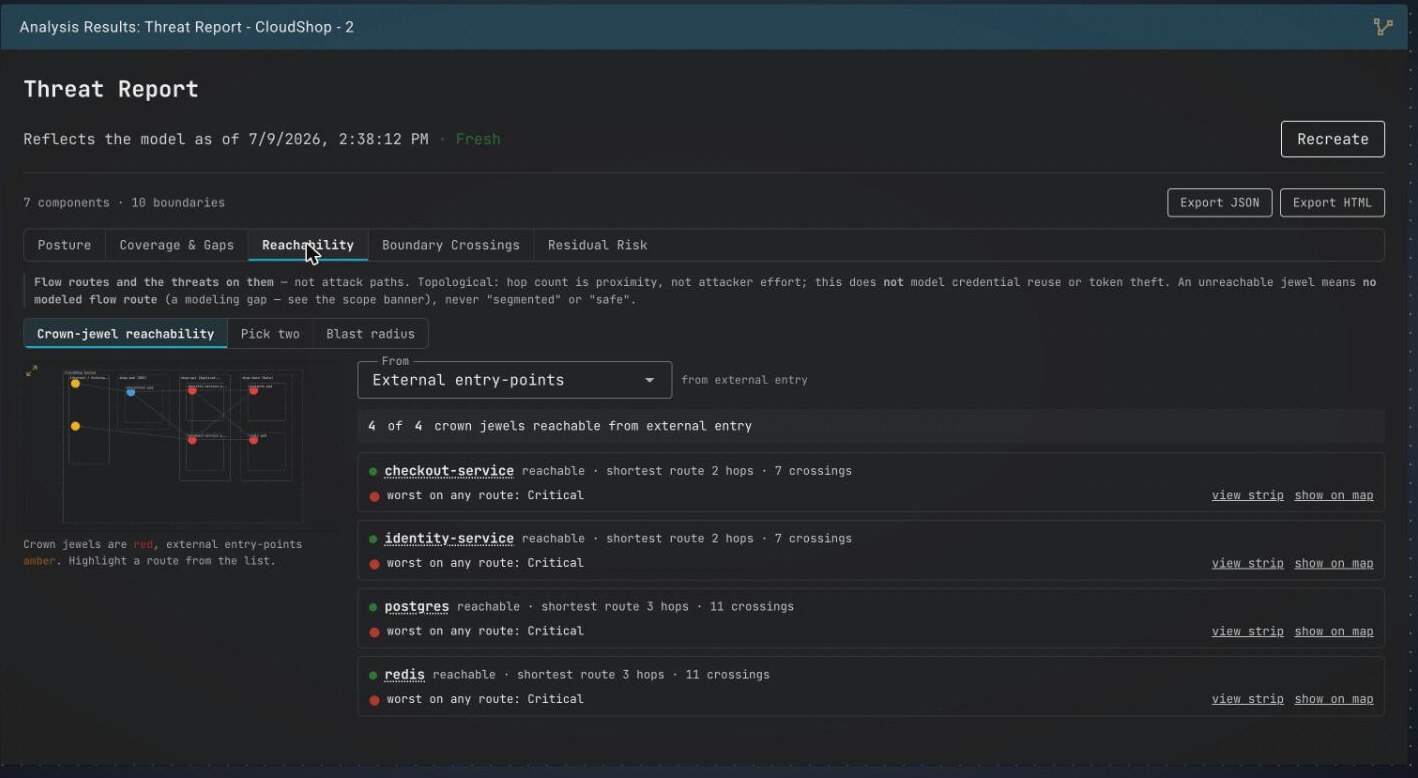
Trace how data reaches your crown jewels — and find the one node that controls every route.
Pick an origin and trace the modeled data-flow routes to your crown jewels, between any two elements, or a node’s full blast radius. For each route: how many hops, where it crosses a boundary, the data sensitivity it carries, and the worst live threat on it.
- Choke-point analysis — control one node and sever every modeled route to the asset.
- Blast radius — pick a node and see everything a compromise could reach downstream.
- Flow routes, not attack paths: a hop count is proximity, not attacker effort — and the tab says so up top.
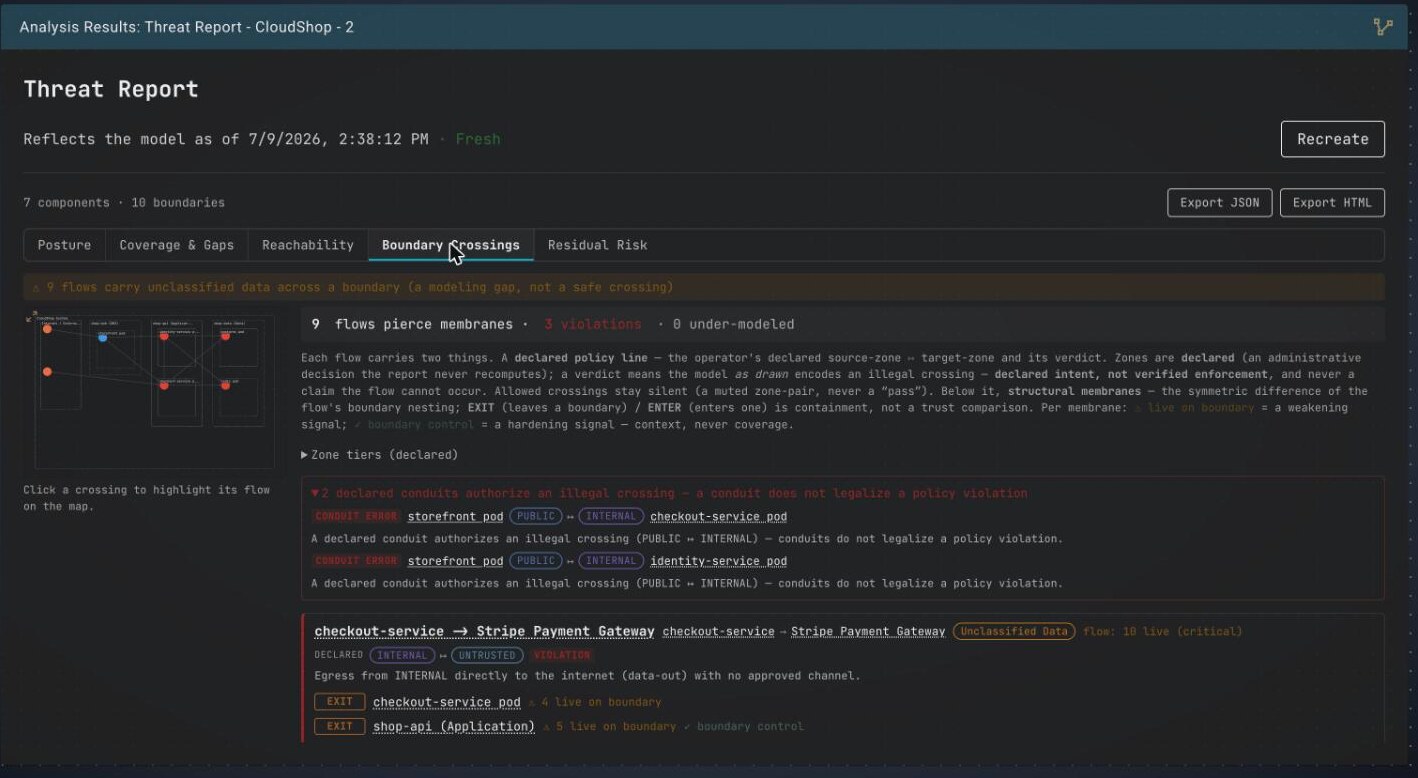
Automatic verdicts on every crossing — checked against the segmentation you declared.
Each crossing carries two layers: the declared source-zone ↦ target-zone policy line, and the structural EXIT / ENTER membranes it pierces. Allowed crossings stay silent; only the ones that break your declared-zone policy raise a word.
- VIOLATION, WARNING, and ADVISORY verdicts — declared intent, never verified enforcement.
- Sensitivity chip per flow; ranked verdict-severity first, so violations surface to the top.
- Conduit-error and dead-intent surfaces catch declarations that don’t match the model.
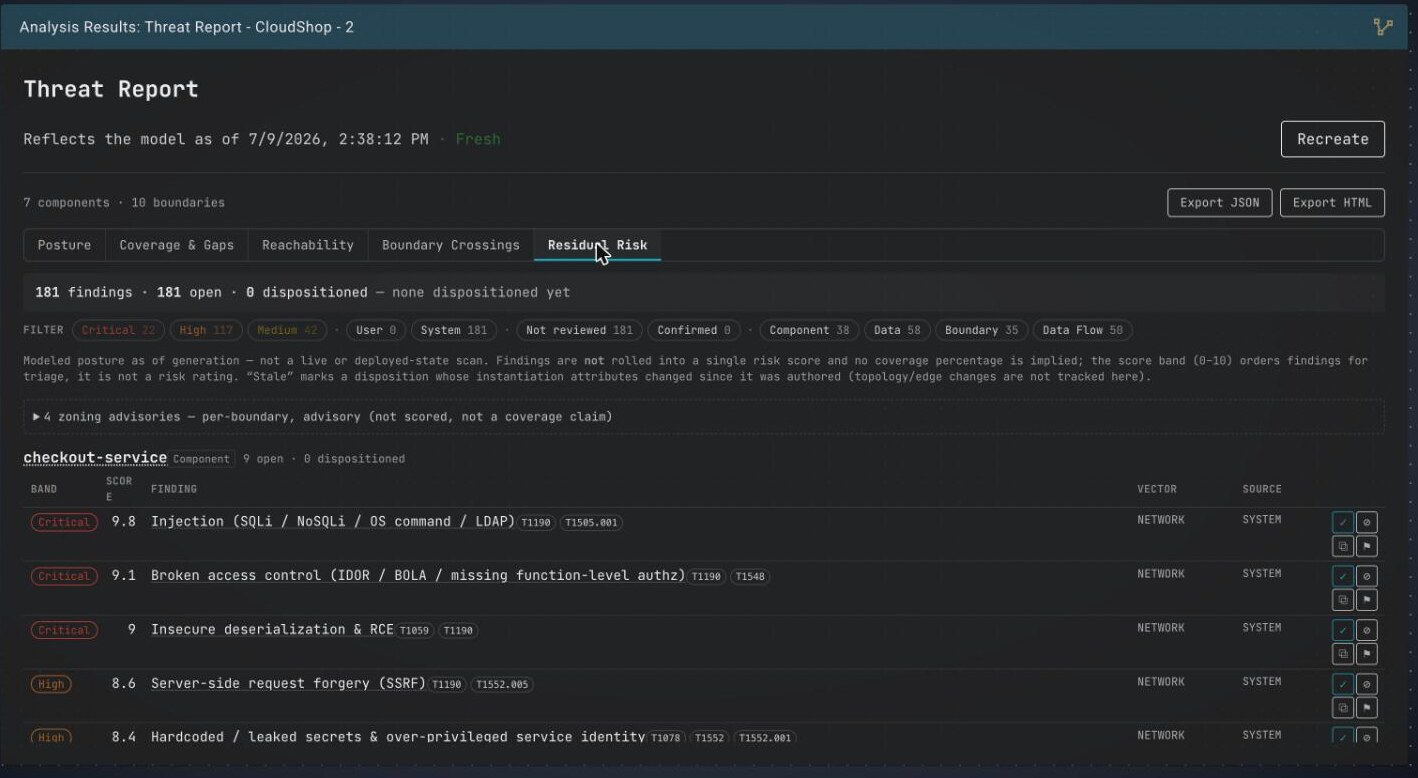
Triage every finding in place — then drill into any element to see why.
Every finding, grouped per element, split into open and reviewed. Triage in place — affirm a confirmed risk, dispose with a reason, raise an issue — then drill into any element’s Component Profile to investigate in depth.
- Score bands order the work for triage — a sort aid, not a grade stamped on your model.
- Six disposition reasons; a compensating-control claim with no control gets flagged.
- Stale dispositions surface when the underlying finding changed after your decision.
What the report
won't claim.
Every figure traces back to your model. Here's what it refuses to invent on your behalf — each omission is why a screenshot of the report can't be turned into a claim you never made.
No single risk score
Signals are kept separate instead of blended into one number — so nothing hides behind an average, and a weak spot can’t be averaged away.
No coverage percentage
Coverage is shown tier by tier and function by function. “80% covered” would blend DIRECT certainty with broad inference and bury detect-only gaps.
No attacker model
Reachability shows flow routes, not attack paths. It never models attacker effort, credential reuse, or exploit chaining. A hop count is proximity, not difficulty.
Not a live scan
Coverage is modeled / design-asserted, not telemetry from a running system. The report is a snapshot; edit the model and it flags itself stale until you recreate it.
A point in time, clearly labelled.
The report renders over the snapshot it stored when you generated it — that's what keeps every tab consistent with every other. Edit the model afterward and the banner switches from Fresh to an amber Stale marker, and the Generate button becomes Recreate. It never auto-updates behind your back, and never nags you for a save that changed nothing.
Two formats, the same caveats.
Export JSON for machine-readable data — diff snapshots over time or feed other tools. Export HTML for a self-contained, printable page you can save as a PDF and hand to a stakeholder. Both carry the coverage facts, reachability rollup, boundary-crossing verdicts, and the ledger — and the same caveats shown on screen. Export is disabled while you have pending decisions, so you never share stale numbers.
Generate a report your board can defend.
The Threat Report is an analysis class in every model's Analysis tab. Build a model, run the analysis, and read your residual risk across five consistent views you can drill, export, and defend.